Understanding Your BRS Analytics
What This Is
The Analytics Dashboard shows how customers interact with your website, products, and booking process.
It helps you understand:
- Website performance
- Customer behavior
- Product demand
- Booking trends
- Marketing effectiveness
- Conversion opportunities
Use this data to make better decisions about pricing, inventory, promotions, and website improvements.
How to Use Date Filters
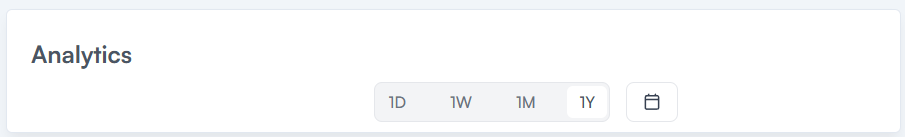
At the top of the Analytics Dashboard, you can change the reporting period:
- 1D (1 Day) – Last 24 hours of activity
- 1W (1 Week) – Last 7 days
- 1M (1 Month) – Last 30 days
- 1Y (1 Year) – Last 12 months
- Custom Date Range (Calendar Icon) – Select specific start and end dates
If you don’t actively switch between these, you’re basically flying blind. Trends only show up when you compare time periods.
Key Metrics Explained
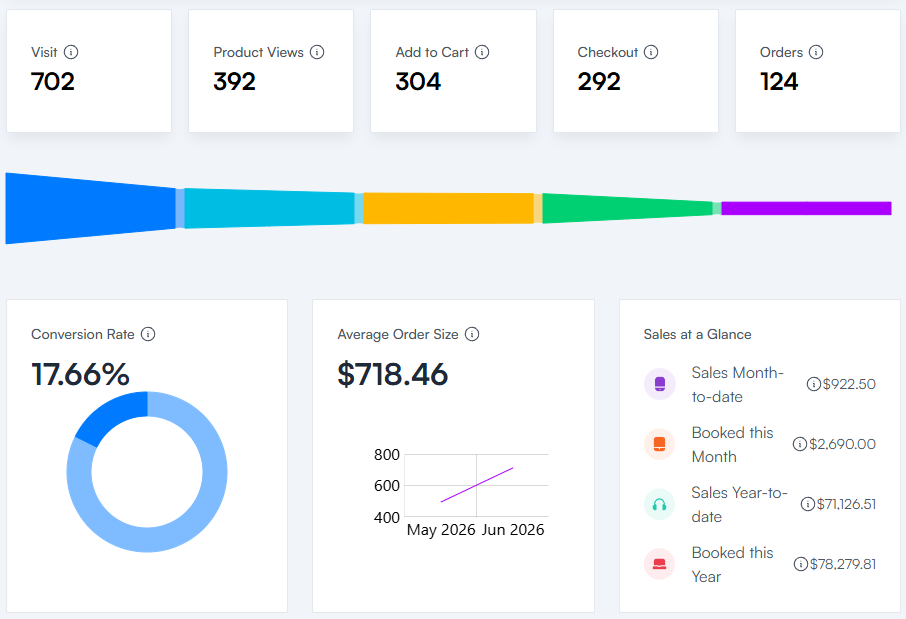
These are the core numbers that show how users move through your website:
- Visits – Number of unique visitors to your website within the selected date range
- Product Views – Total number of times product pages were viewed
- Add to Cart – Number of times products were added to carts
- Checkout – Number of times users reached the checkout page
- Orders – Number of completed bookings (successful payments)
- Conversion Rate – Orders ÷ Visits (percentage of visitors who book)
- Average Order Size – Average value spent per order
If your funnel looks like this:
High Visits → Low Add to Cart → Low Orders
The problem is usually your product pages, not your traffic.
Sales at a Glance
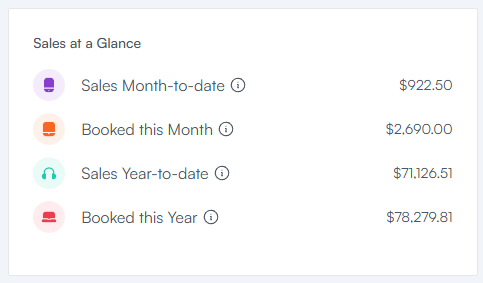
These metrics show revenue performance over time:
- Sales Month to Date – Money collected this month (minus refunds)
- Booked This Month – Value of orders starting this month (regardless of payment status)
- Sales Year to Date – Money collected since January 1 (minus refunds)
- Booked This Year – Value of all orders scheduled this year (regardless of payment status)
Important distinction:
- Sales = money actually collected
- Booked = scheduled revenue (not always paid yet)
If you confuse these two, you will misread your business performance.
How to Access Analytics
- Log in to your BRS Dashboard
- Go to Website → Analytics
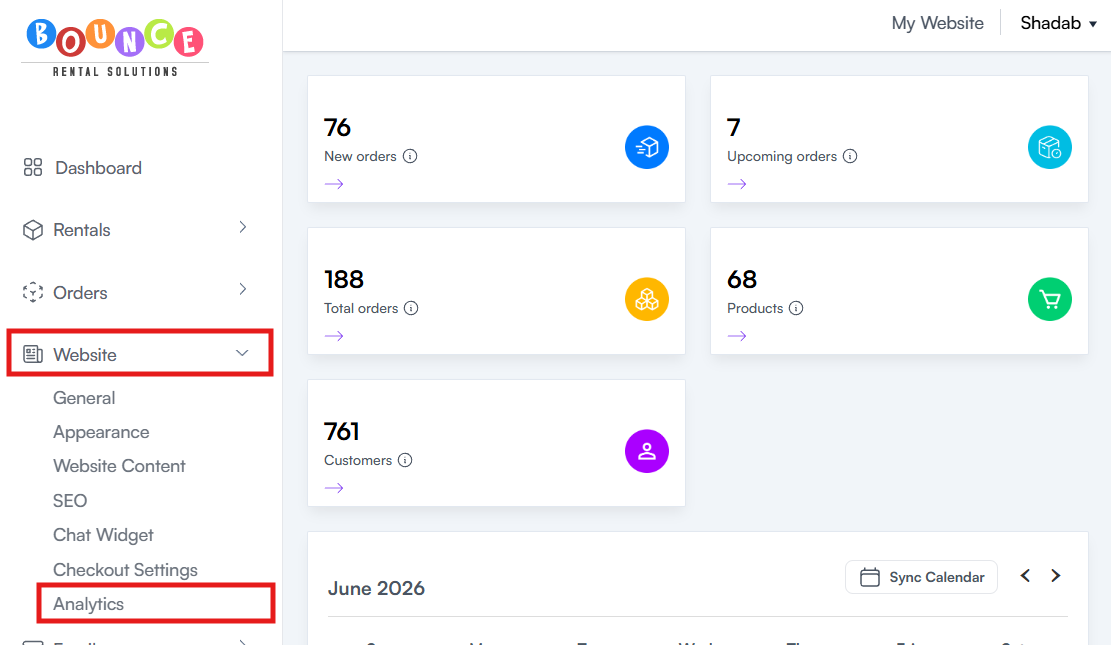
The dashboard contains multiple sections showing website activity and booking performance
Top Products (Added to Cart)
This section shows which products are most frequently added to carts.
It helps identify:
- High-interest inventory
- Popular products
- Strong engagement items
Important: Add-to-cart does NOT guarantee bookings.
Why This Matters
High add-to-cart activity usually means:
- Strong demand
- Effective photos
- Competitive pricing
- Popular categories
These are strong candidates for:
- Homepage features
- Promotions
- Upsell bundles
Low Conversion Products
This section shows products that get attention but fail to convert into bookings.
A conversion rate = percentage of visitors who complete a booking after interacting with a product.
Why This Matters
Low conversion usually signals:
- Pricing issues
- Weak product descriptions
- Poor or unclear photos
- Missing key details
- High delivery fees
- Strong competitor alternatives
Questions You Need to Ask
- Is the price justified?
- Do the photos sell the product or confuse people?
- Is the description complete and specific?
- Is anything critical missing?
- Would a first-time visitor understand this instantly?
Small fixes here often produce large revenue gains.
Premium Impact
This section tracks engagement from Premium features:
Chat Submissions
Leads generated through the website chat widget
Used to measure:
- Customer interest
- Lead quality
- Booking intent signals
Pop-Up Submissions
Leads captured from pop-ups such as:
- Discount signups
- Email subscriptions
- Lead forms
Abandoned Checkout Emails/Texts
Users who started checkout but did not complete booking and received follow-ups.
Reference: Understanding Abandoned Checkout Notifications (Premium Feature)
Why Analytics Matter
Most businesses obsess over completed bookings. That’s a mistake.
Analytics shows what happens before the booking.
Example pattern:
- High traffic
- High cart activity
- Low conversion
That usually means your product page is leaking revenue.
Best Practices
Review Regularly
- Weekly during busy seasons
- Monthly during slower periods
If you only check occasionally, you miss trends early.
Focus on Behavior
Pay attention to:
- Viewed products
- Added-to-cart products
- Low conversion products
These show real demand vs friction.
Test Changes
If conversion is low, test:
- Better photos
- Stronger descriptions
- Pricing adjustments
- Clear feature highlights
- Social proof (reviews)
Then re-check analytics. If you’re not measuring before/after, you’re guessing.
Important Notes
Analytics are indicators, not absolute truth.
Use them alongside:
- Booking reports
- Revenue reports
- Customer feedback
- Operational context
A “low-performing” product might just be poorly presented, not unwanted.
Additional Recommendations
Don’t just look at numbers. Look for patterns:
- What gets attention but doesn’t convert?
- What converts without much traffic?
- What gets ignored completely?
- What consistently drives revenue?
That’s where the real decisions come from.